Reports
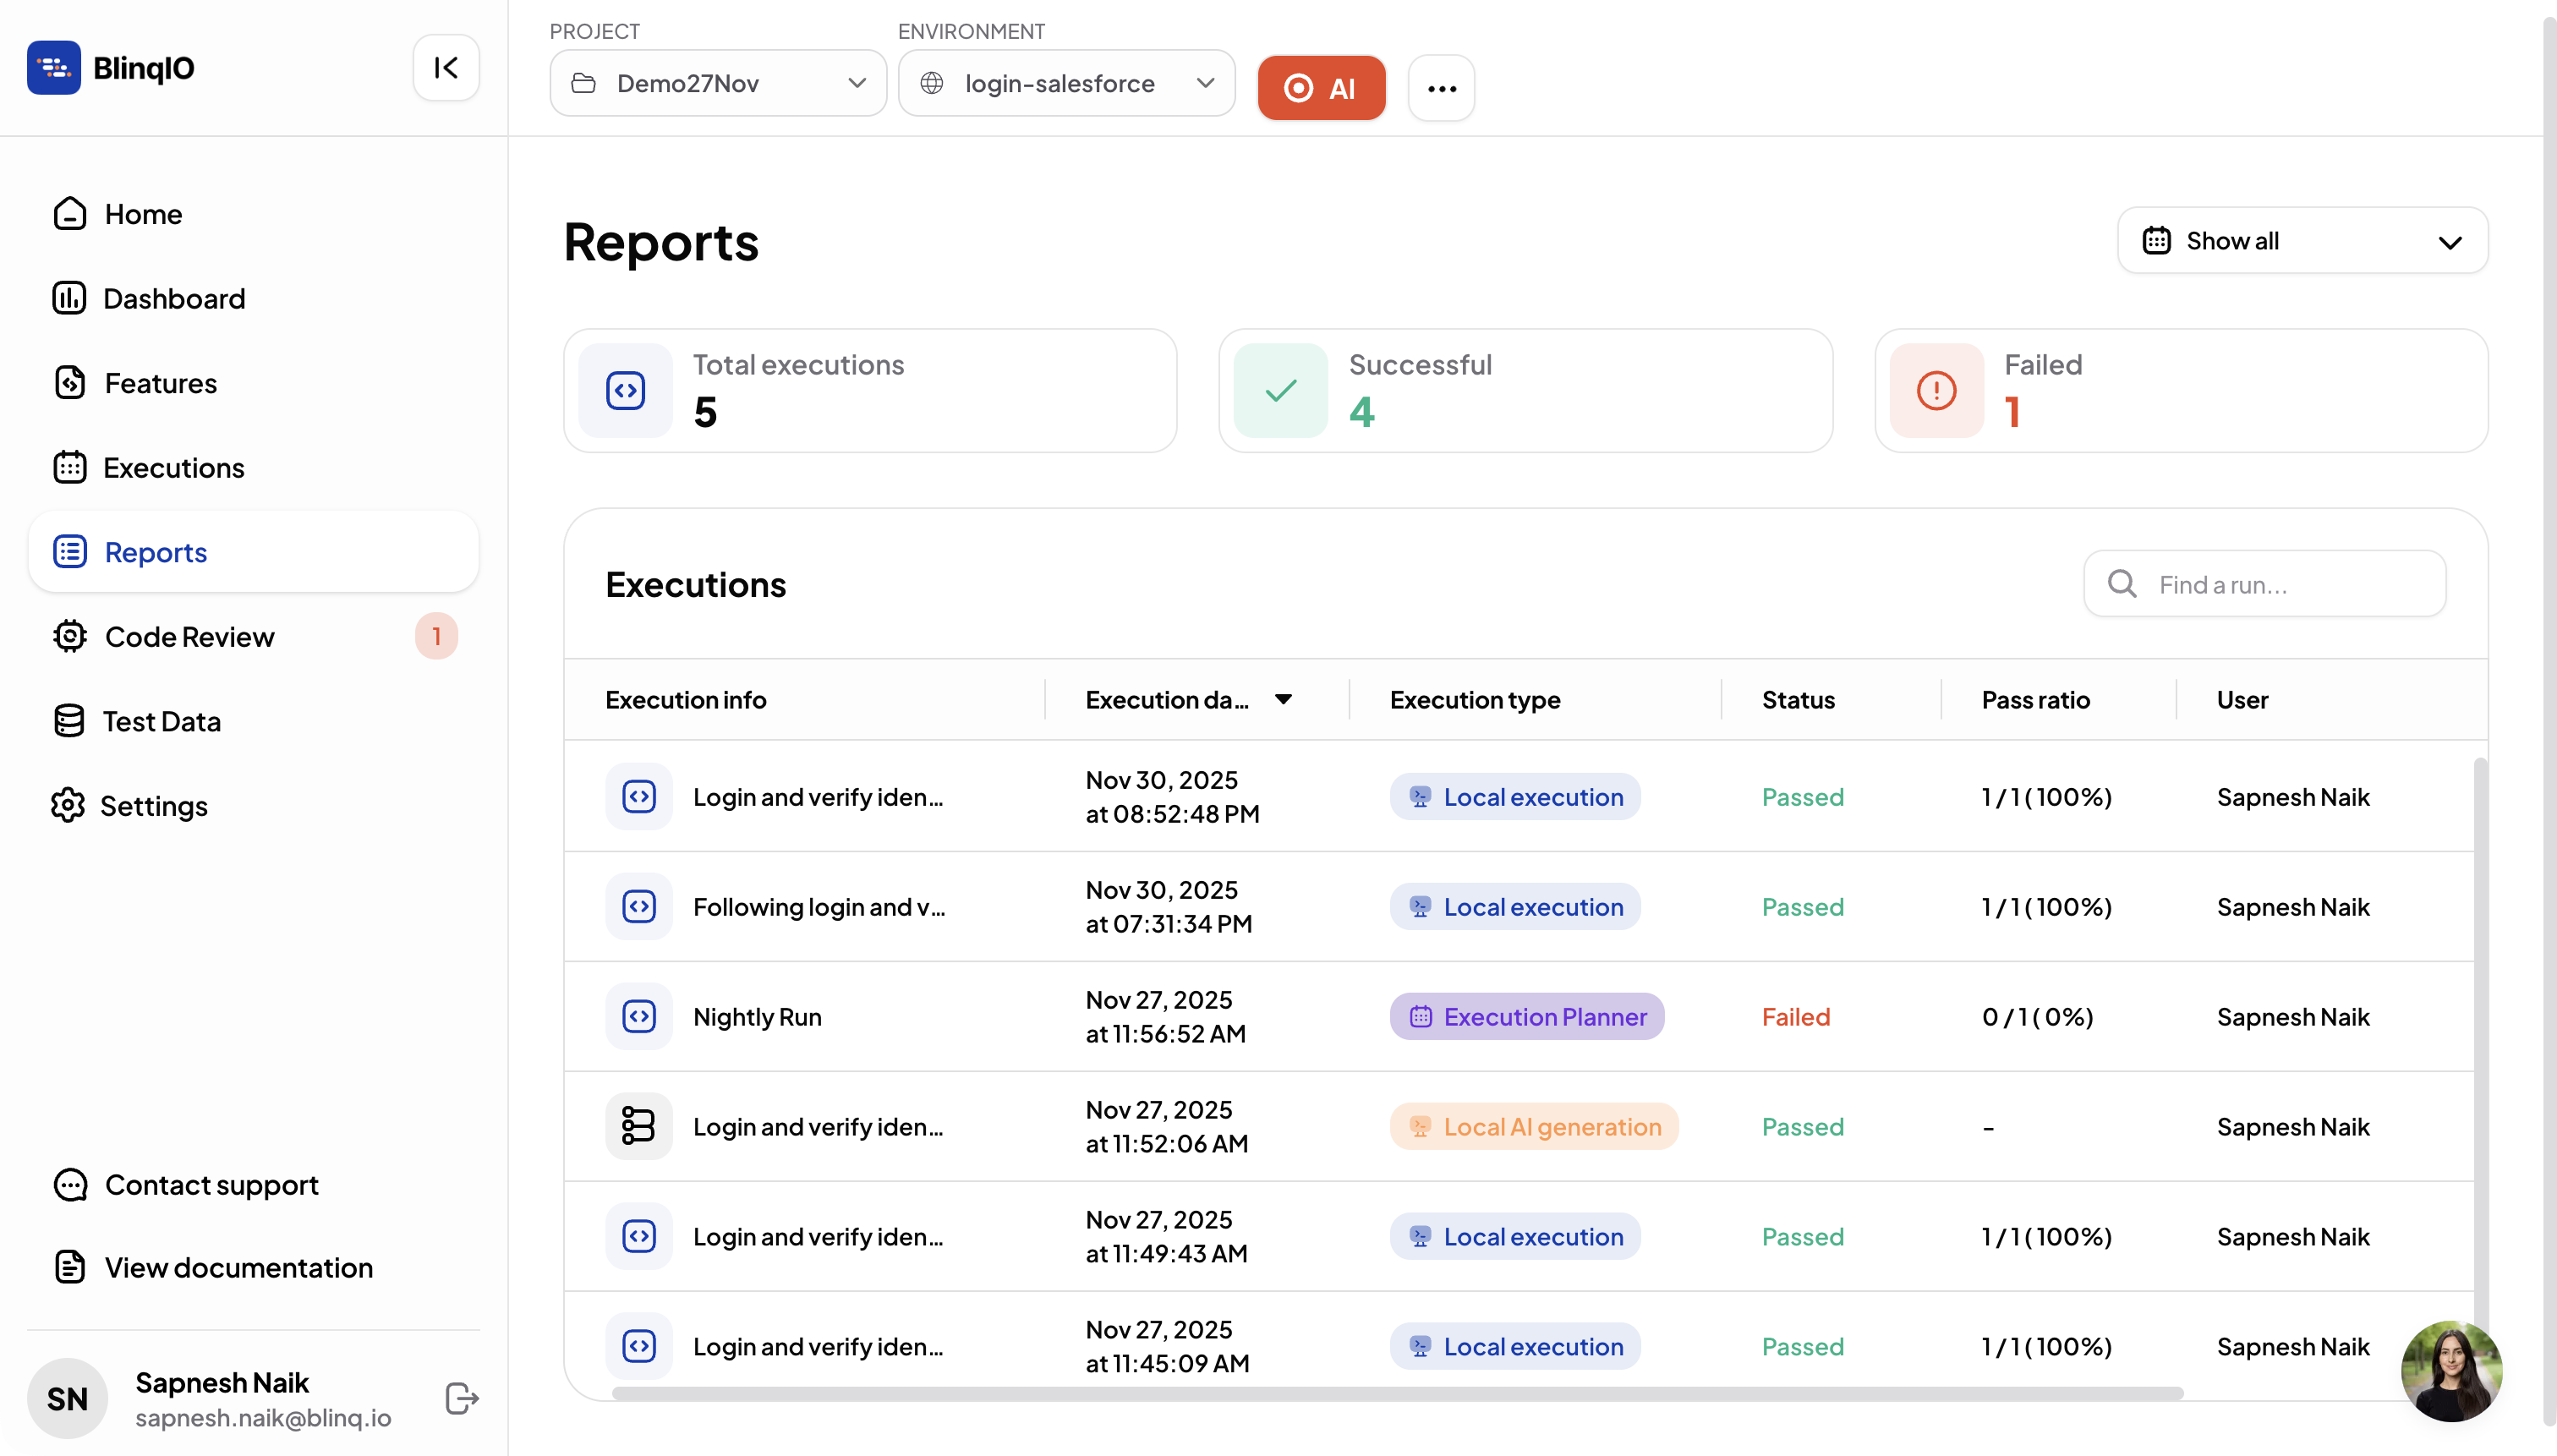
The Reports page provides a centralized view of all test executions within a project. Each execution represents a complete test run that may include multiple scenarios and example rows.
Report Types
The AI Test Engineer generates different types of reports depending on how a test was executed.
Run Report
- Created when tests are executed manually or with the AI Recorder.
- Labeled as Execution Type: Local Execution.
AI Recovery Report
- Generated when AI detects and fixes failures.
- Includes details of recovered scenarios and retraining actions.
This report includes:
- Error Message – The original failure message.
- Root Cause – A short explanation of why the failure occurred.
- Retraining Reason – The reason retraining was triggered (for example, locator mismatch, timeout).
Note
For details on AI Recovery Reports, see Run Tests.
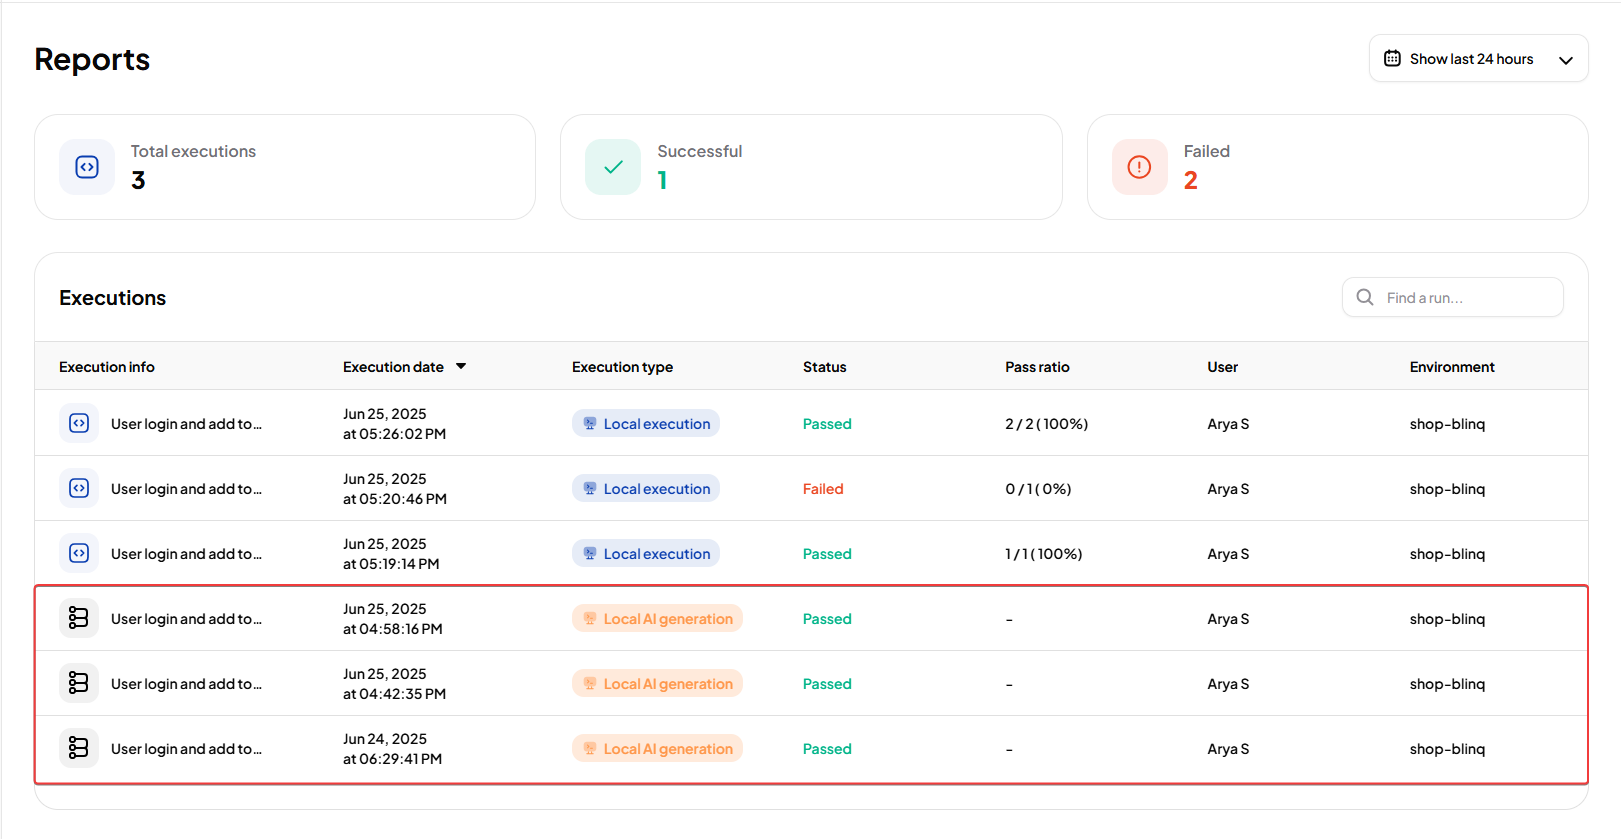
AI Generation Report
- Created when scenarios are generated or updated by AI.
- Displays AI-generated steps and their results.
- Labeled as Execution Type: Local AI Generation.
Execution Summary
The top of the Al Analytics & Reports page shows a summary of all project test executions. This helps you quickly assess test activity and overall project health.
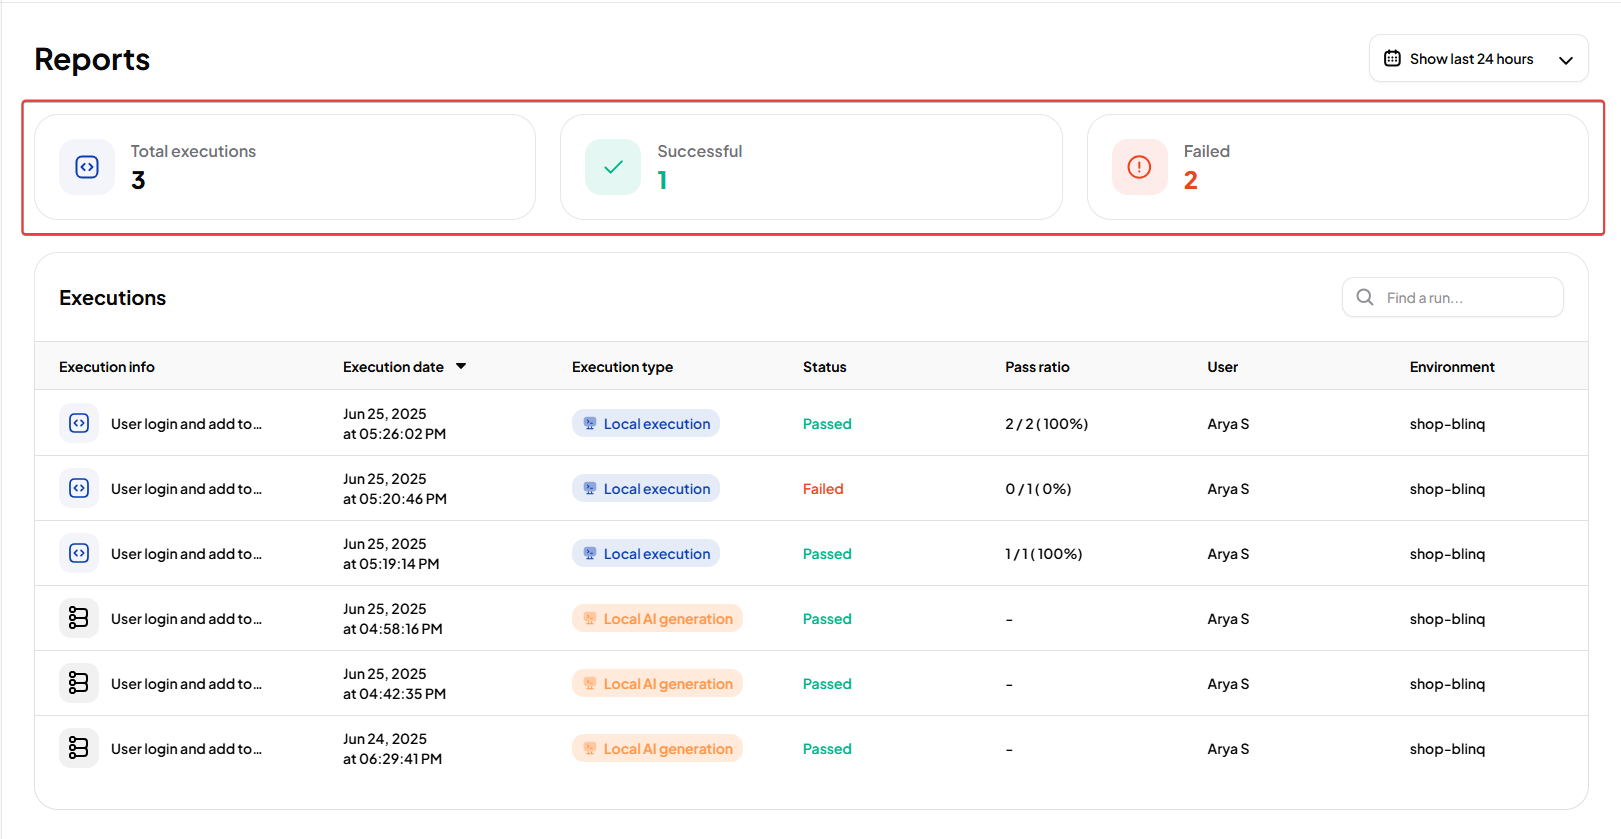
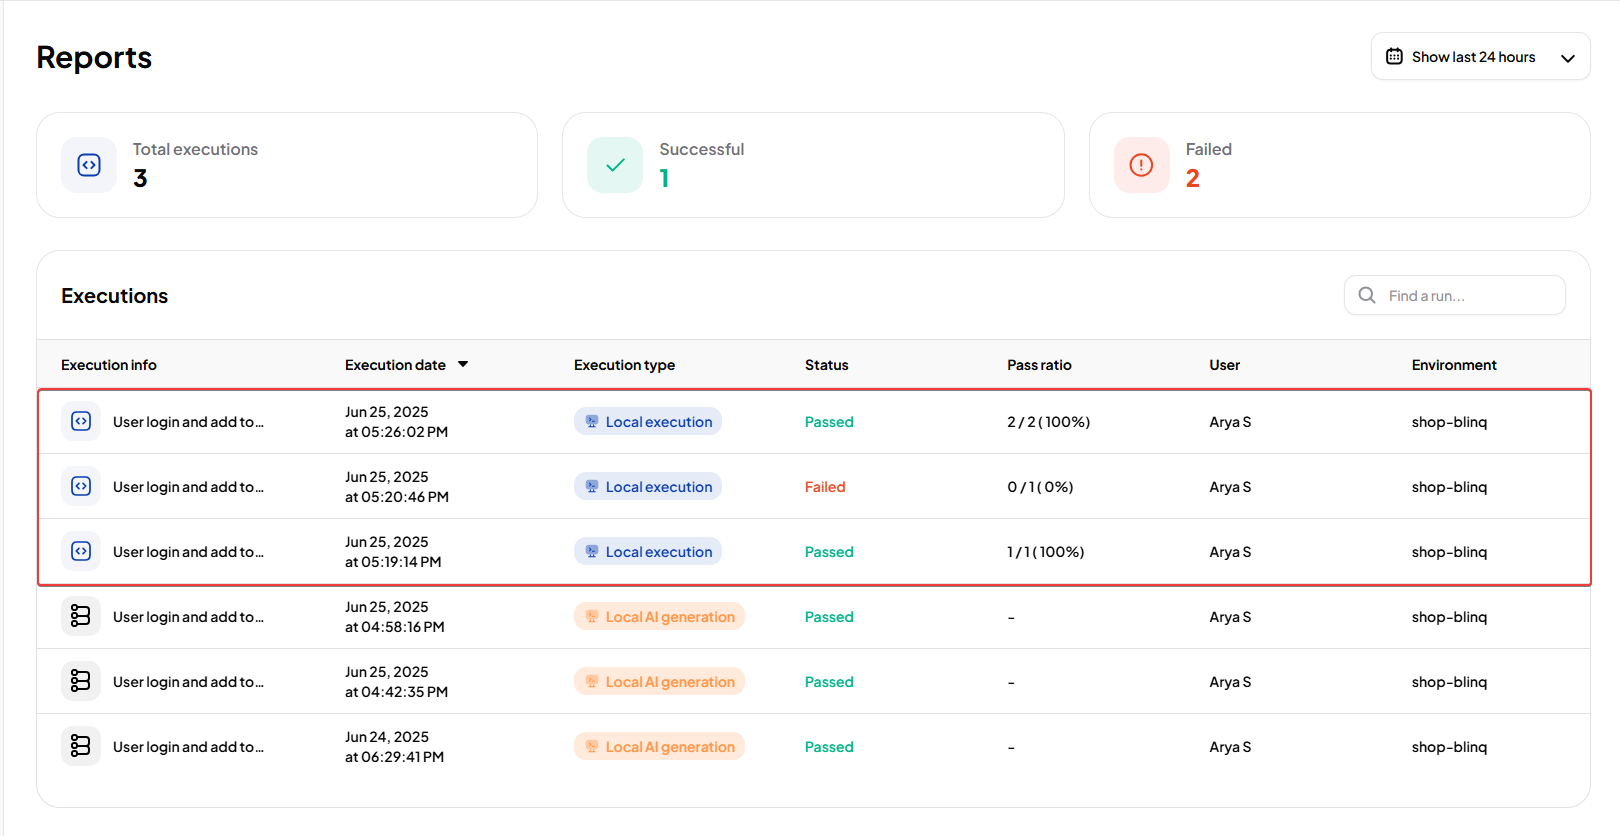
Summary Metrics
| Metric | Description |
|---|---|
| Total Executions | Total number of test runs in the project. |
| Successful | Runs where all scenarios passed. |
| Failed | Runs where one or more scenarios failed. |
This summary updates automatically as new tests are executed.
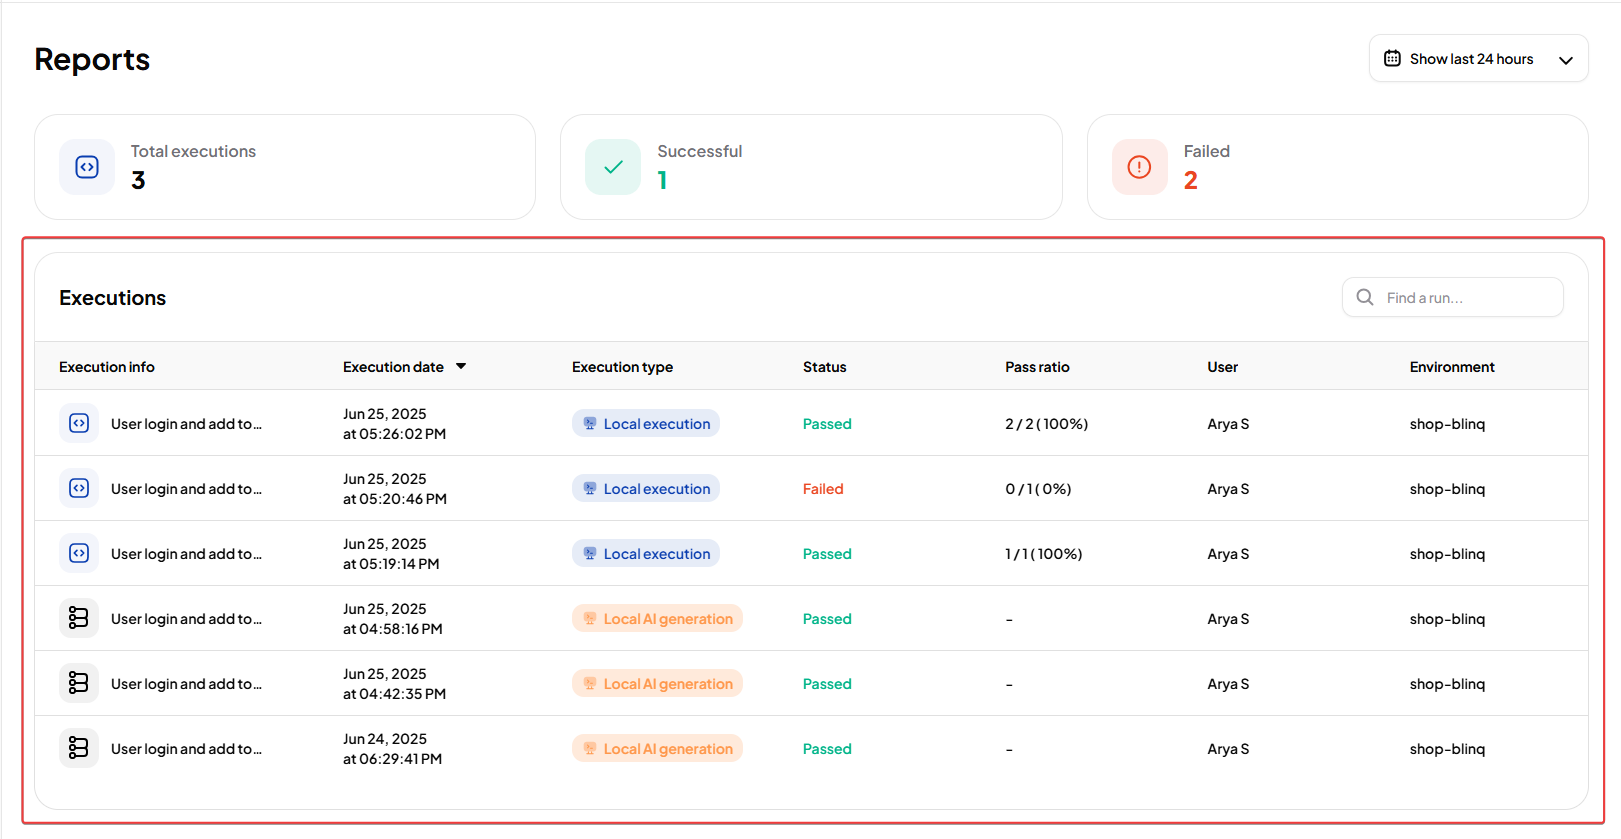
Execution Table
Below the summary, executions are listed in a table. Each row represents a run with detailed information.
| Column | Description |
|---|---|
| Execution Info | Unique identifier or summary of the run. |
| Execution Date | Timestamp when execution started. |
| Execution Type | How the run was triggered (for example, Local Execution, AI Generation). |
| Status | Result of the run (Passed, Failed, Error fixed by AI). |
| Pass Ratio | Number of passed scenarios vs. total executed. |
| User | Person who initiated the run. |
| Environment | Target environment or URL of execution. |
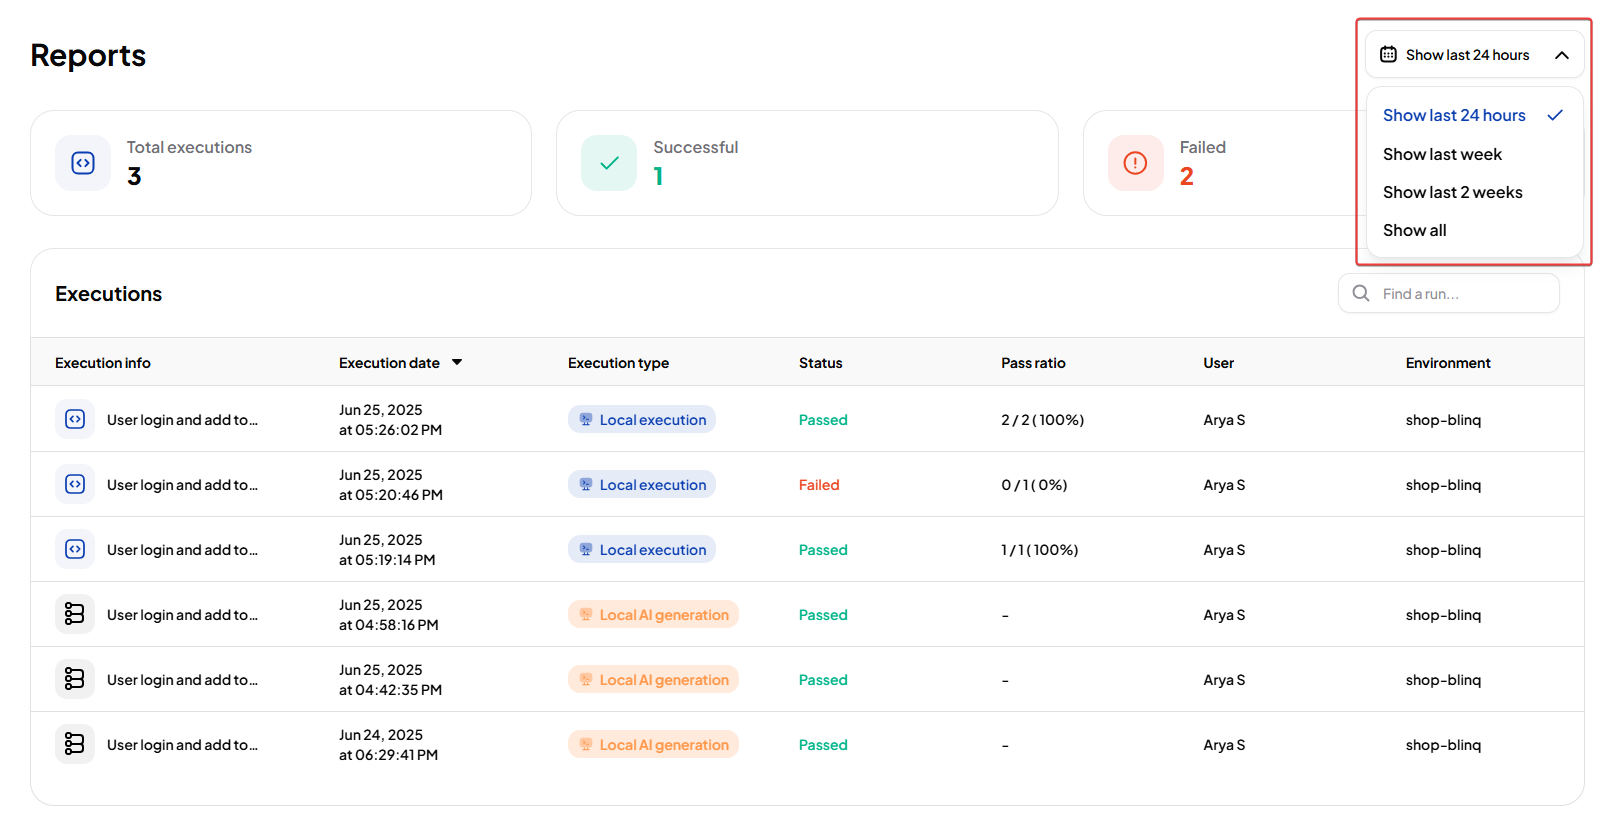
Execution Filters
You can filter runs by time range:
- Last 24 hours
- Last week
- Last 2 weeks
- Show all
Opening a Report
Select any execution row to open a detailed report. Reports show all scenarios from that run.
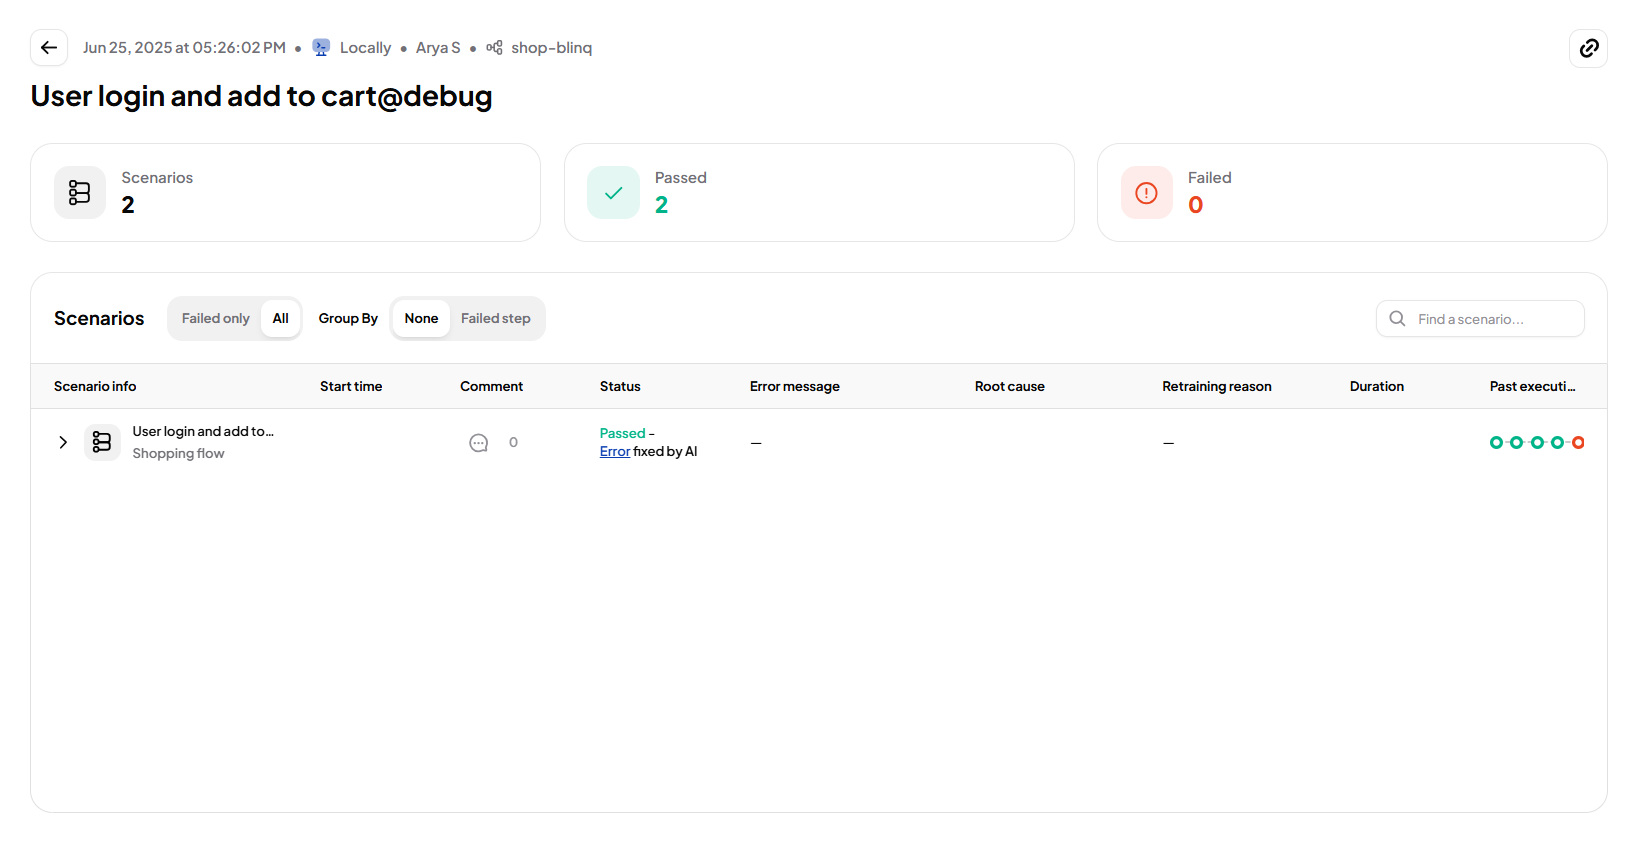
Scenario Details
Each scenario displays:
- Start Time – When execution began.
- Status – Passed, Failed, or Recovered (AI).
- Error Message – Details if the scenario failed.
- Root Cause – AI-generated explanation of the failure.
- Retraining Reason – Cause for AI retraining, if applied.
- Duration – Total execution time.
- Past Executions – Color-coded history of the last 5 runs.
- User Comment – Optional notes from the test executor.
Expand a scenario with the dropdown arrow to view its recent execution history.
Step-by-Step Details
Within a scenario, BlinqIO captures detailed execution data for debugging and analysis.
For each step, you can view:
- Screenshots – Captured at key checkpoints.
- Console Logs – Relevant app or browser console output.
- Network Logs – Requests and responses triggered during the step.
- Errors – Failure messages when steps fail.
- Stacktrace – Technical error trace (shown only for failed steps).
- Substeps – Available when a step includes multiple interactions.
These details allow you to trace the execution flow and diagnose failures efficiently.