Debug Test Automation Code in VS Code
Learn how to debug a scenario using Visual Studio Code (VS Code).
Prerequisites
Make sure you have the following ready before debugging:
- An implemented scenario using GenerateAll, GenerateStep, Recorder, or API App.
Generate and Copy the Run Command
Go to the AI Tests page and locate the scenario you want to debug.
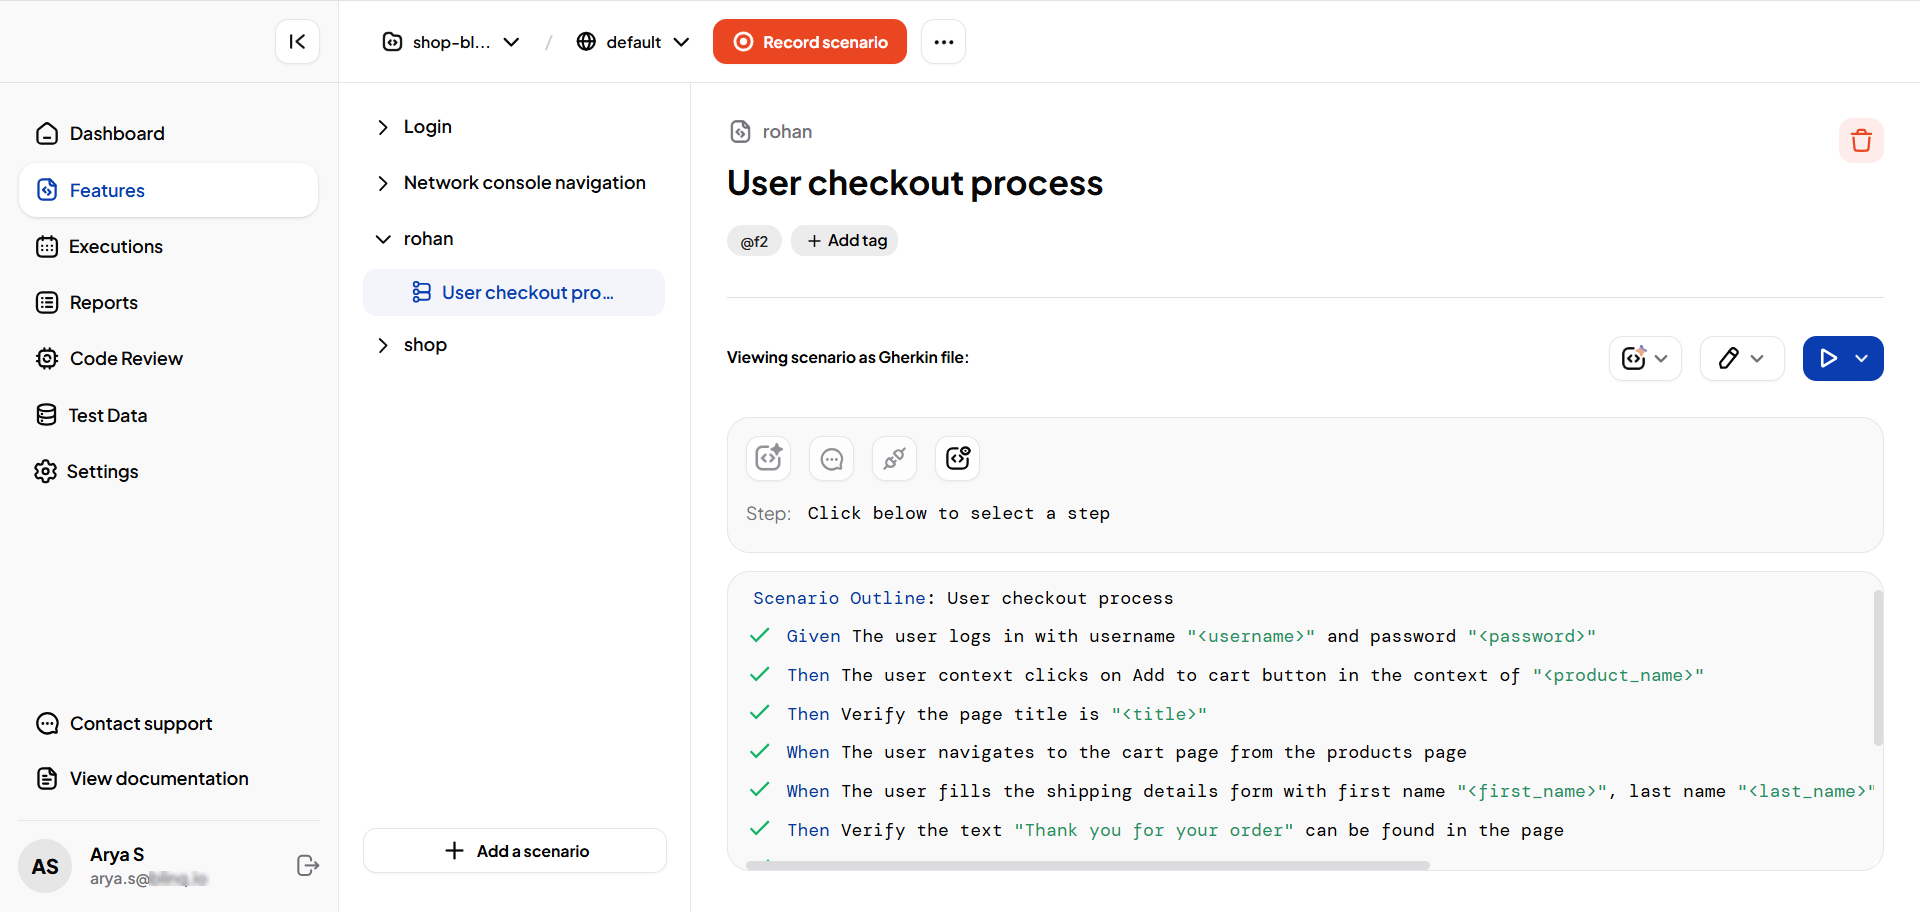
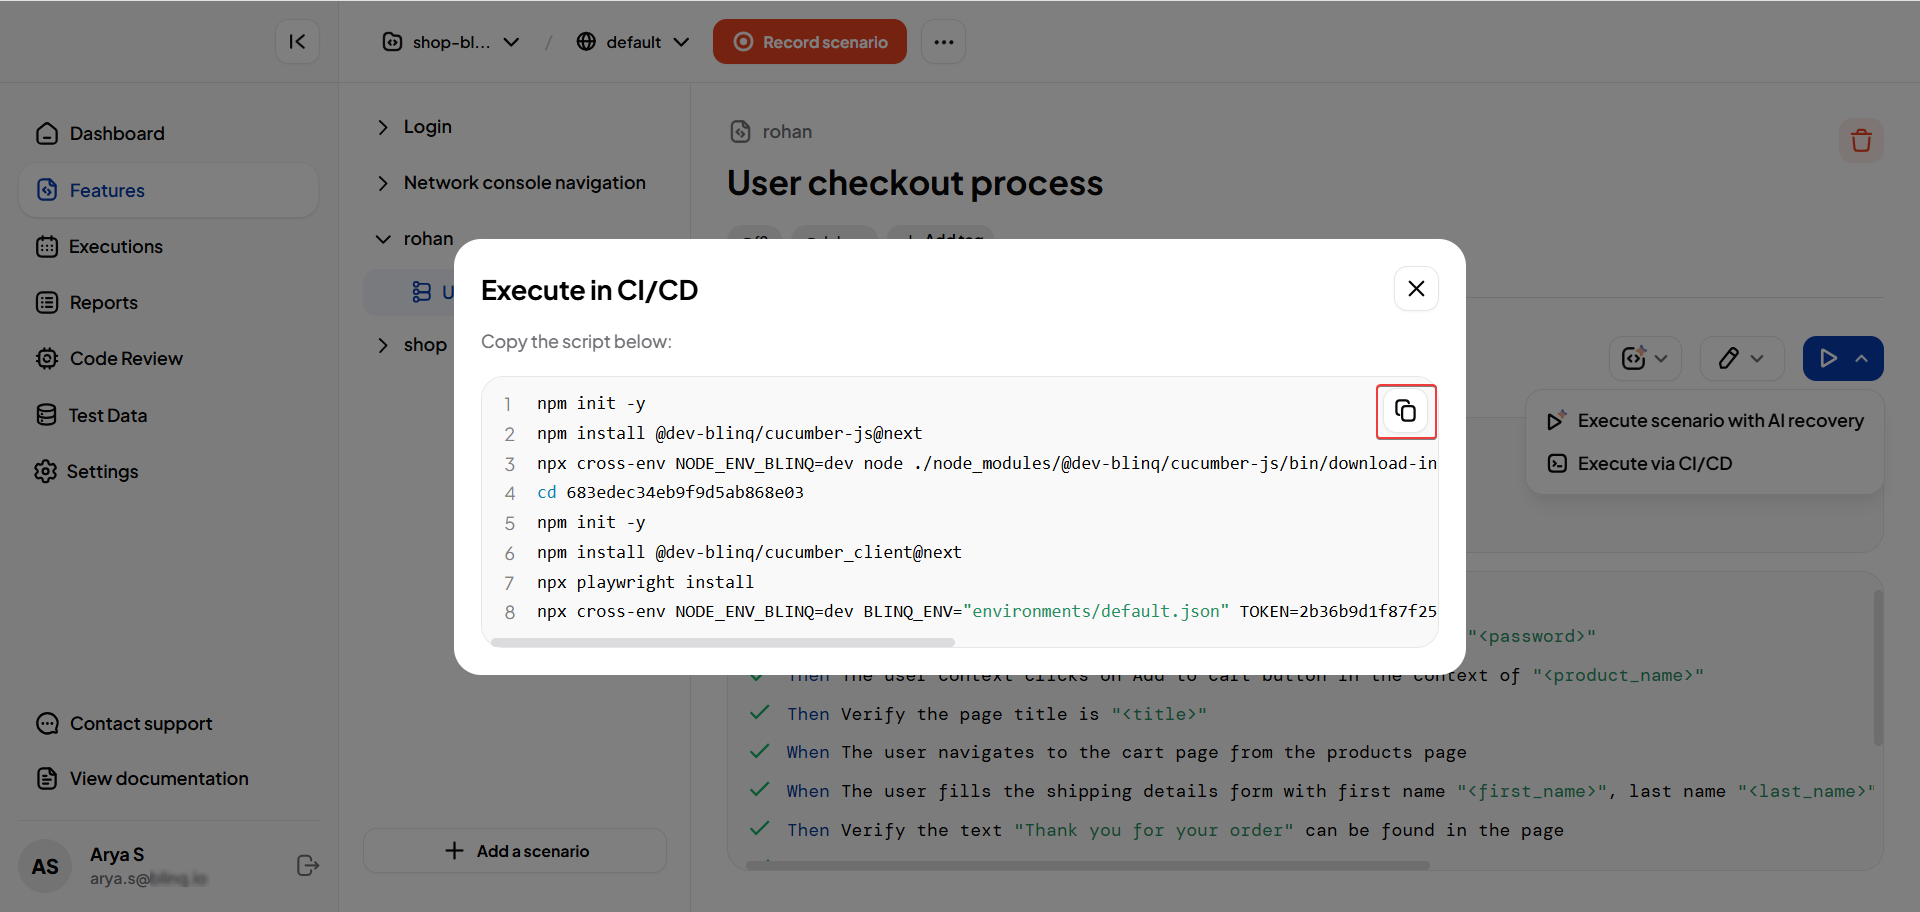
Click the Execute/Run button and select Run via CI/CD.
Copy the generated command to your clipboard.
Open the Project in VS Code and Start Debugging
Now you’re ready to debug the test automation code in VS Code:
On the Project page, click the three-dot menu and select Open in VS Code. This will sync the project to your local system and open it in VS Code.
Note
To know more see View Generated Code.
Open the automation code file (
.mjs) underfeatures/step_definitionsin VS Code and add a breakpoint in the function you want to debug.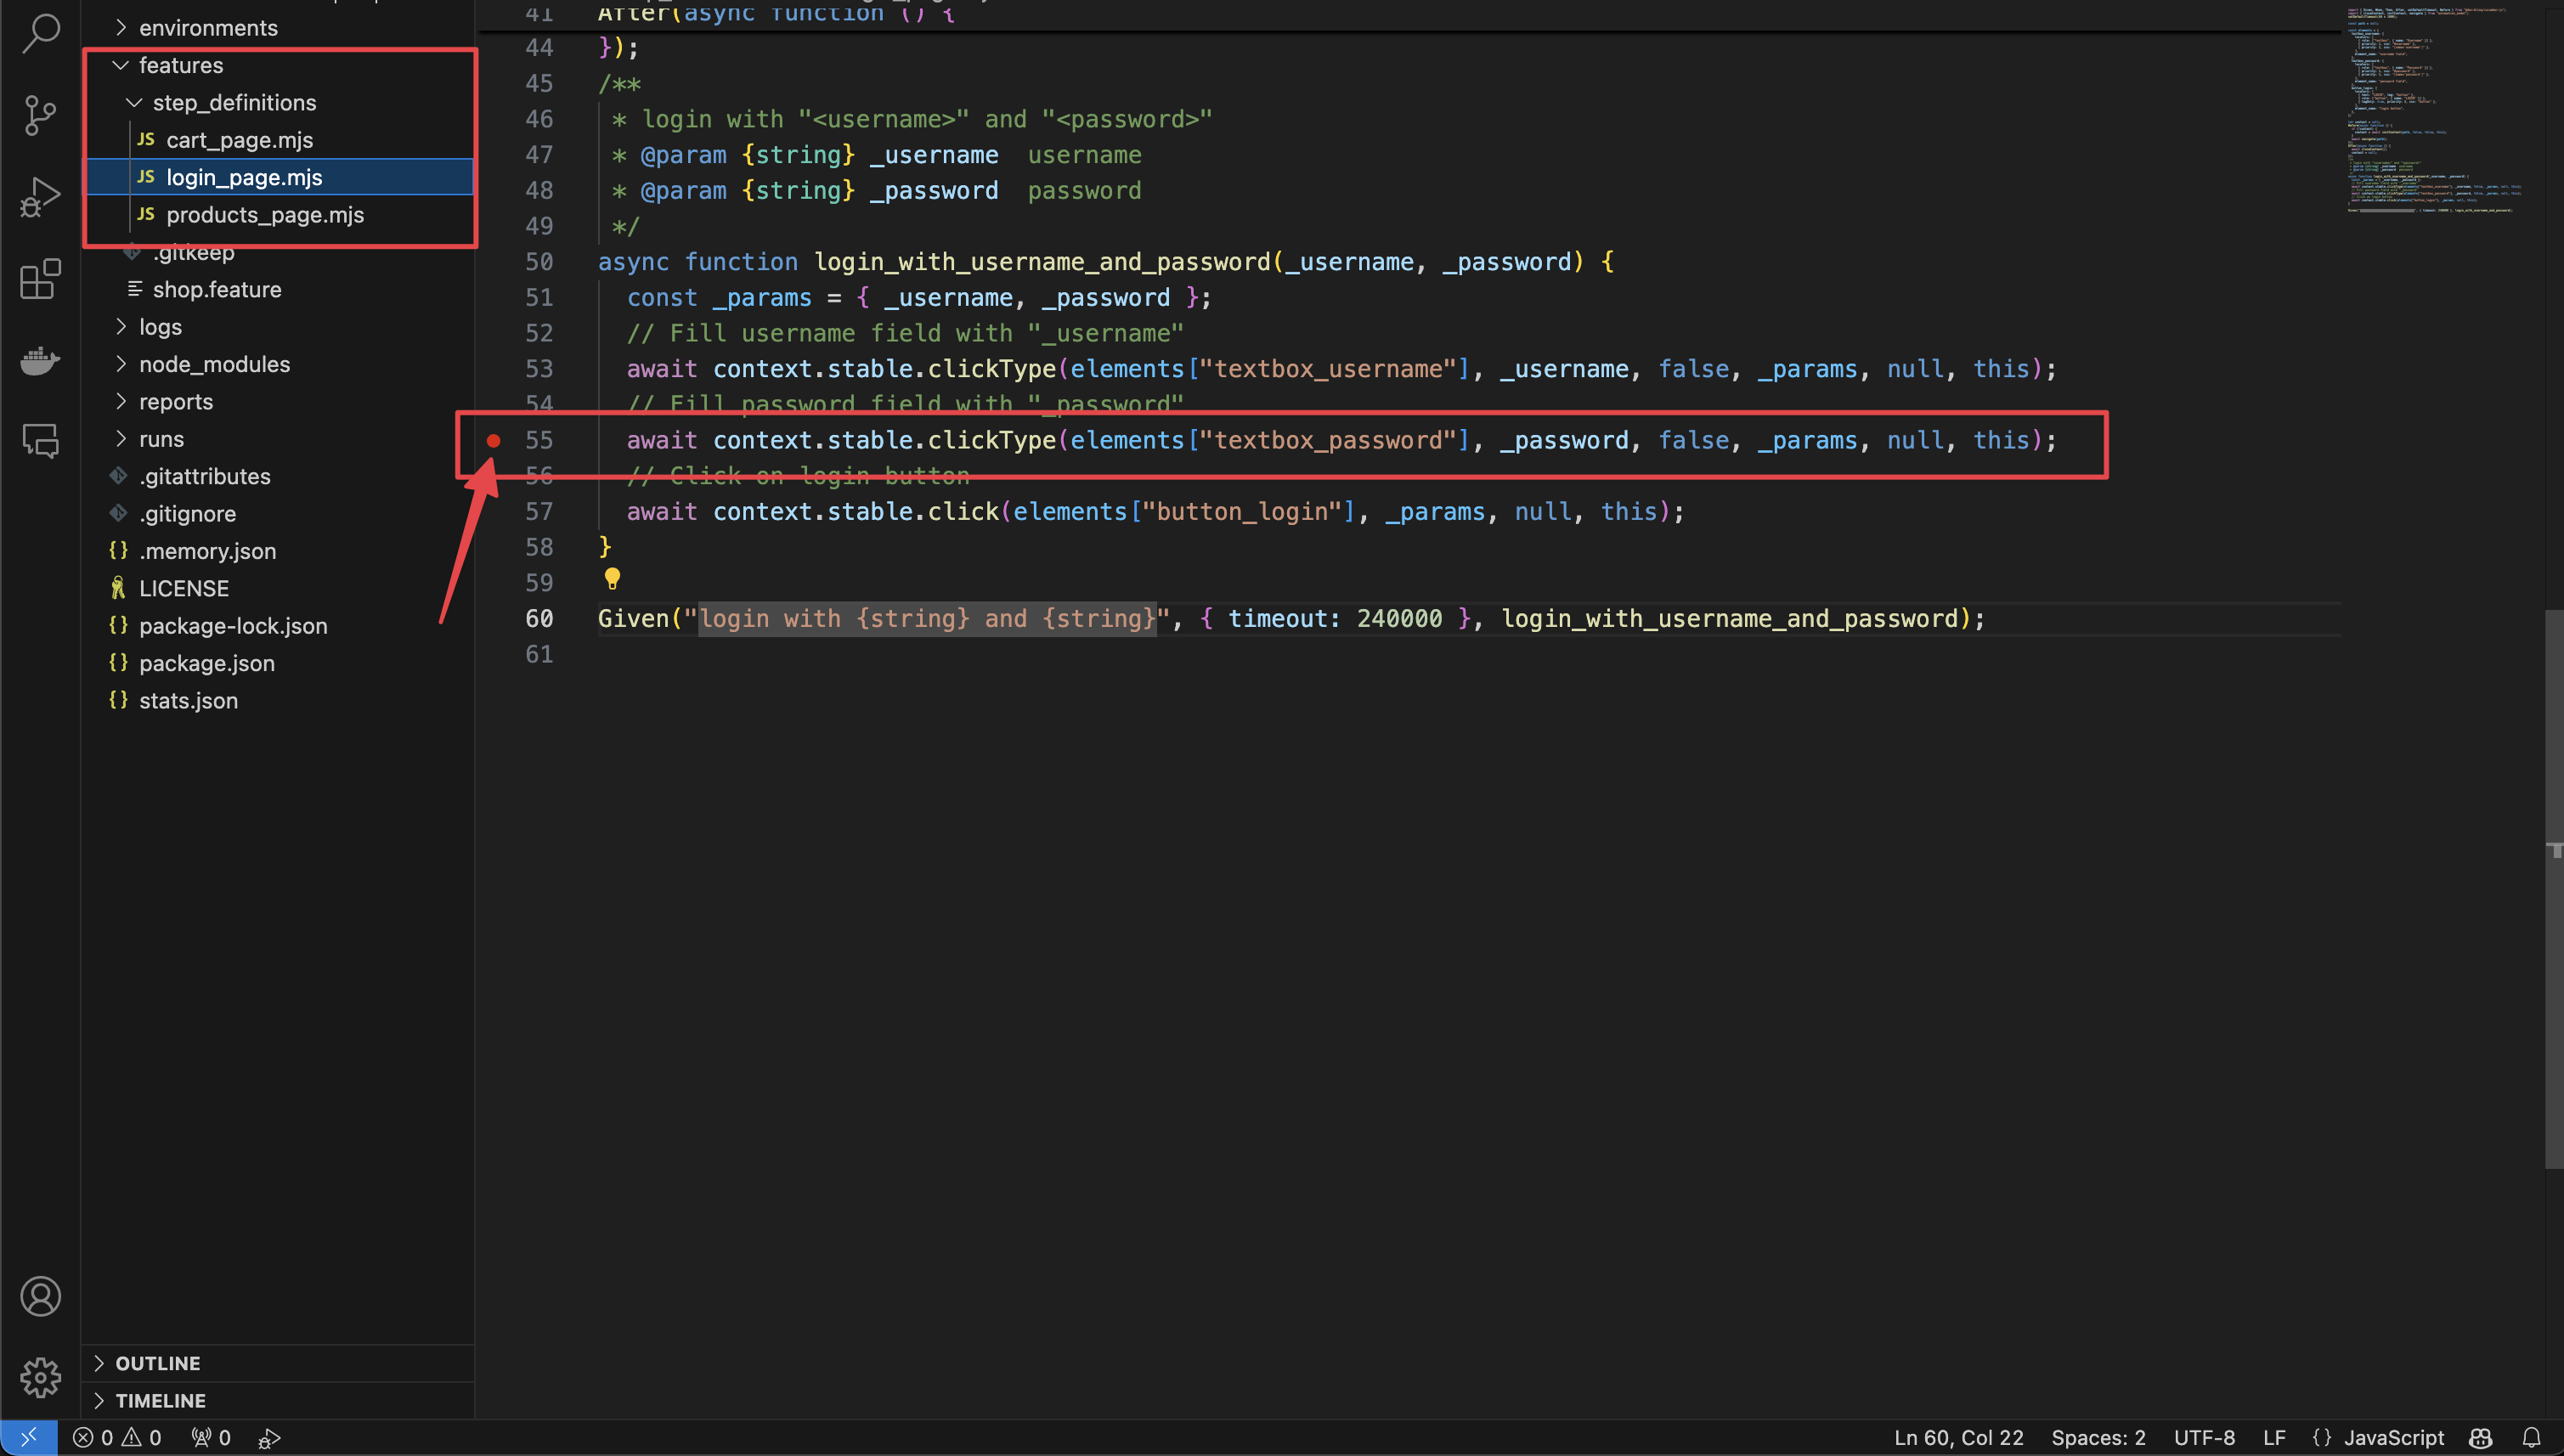
Open the terminal in VS Code by selecting View > Terminal or by pressing Ctrl+`.
Switch to the JavaScript Debug Terminal by selecting Create JavaScript Debug Terminal from the terminal dropdown.
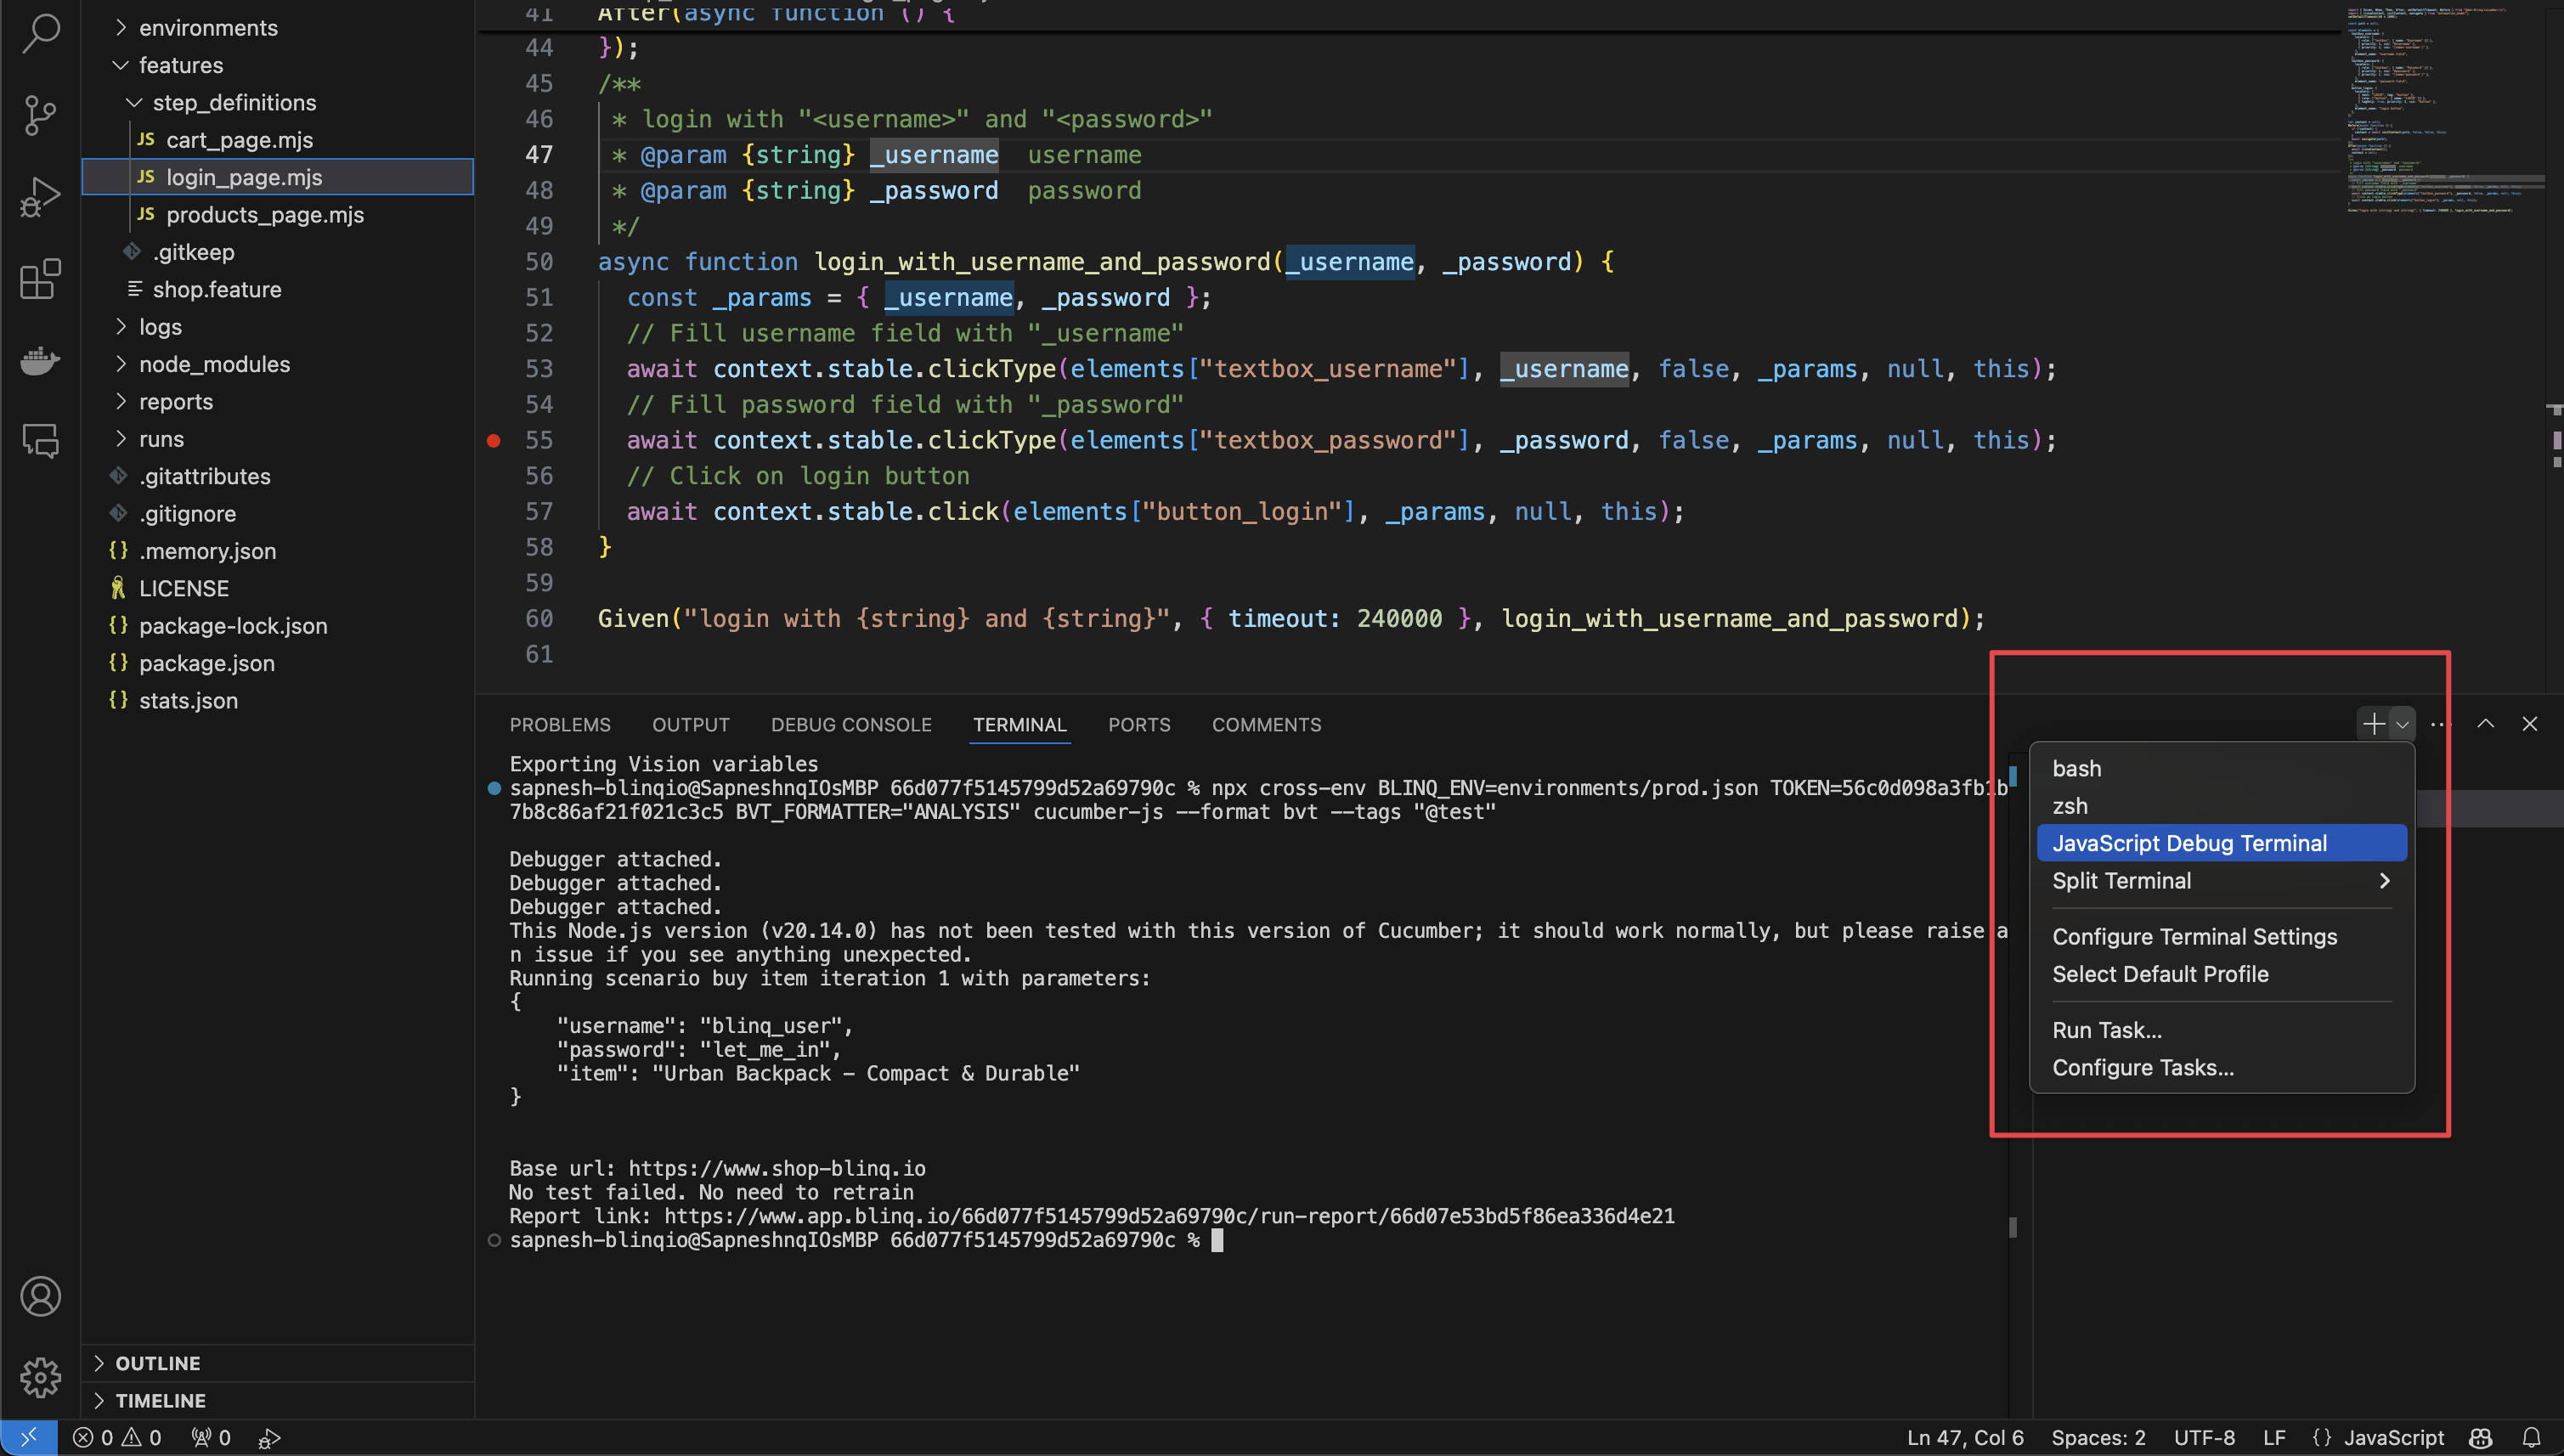
Paste and run the command you generated earlier in the JavaScript Debug Terminal. The test will start running, and the debugger will stop at any breakpoints you’ve set.
For more details on debugging in VS Code, check out the VS Code Debugging Documentation.